


By Deputy Chief Riley Land, Columbus GA. EMA
Editor's Note: This is the fifth installment of "The 400 Foot View", a series to educate and assist organizations in investigating and acquiring the right unmanned air assets for their search and rescue and disaster response missions.
Earlier articles addressed some rather theoretical philosophies about working to get your Unmanned Aircraft System (UAS) program accepted by management and bringing it into the mainstream of the public safety response structure within your organization. That’s great but I think it’s time to get busy and start discussions about the true science of UAS and using this science to make it work better and more effectively for us. We are big boys and girls and most likely have a true bent toward cool brain teasers or we wouldn’t be in the UAS business to start with, so hitch up your science britches and let’s get technical. In the immortal words of astronaut Mark Watney from the movie The Martian, “In the face of overwhelming odds, I'm left with only one option, I'm gonna have to science the (blank) out of this.”
The availability and increased use of UAS by public safety departments for various missions has brought forth the need for UAS pilots and sensor operators to better understand the capabilities and limitations of the systems that they are charged with operating. While the assigned objectives may vary greatly from mission to mission, one commonality always exists; the ability to see clearly and to find the target as quickly as possible. This is never as important as when the mission is search and rescue. The UAS operator and team may be tasked with finding a vehicle, a lost child, an overdue hunter, persons stranded in or on the water or possibly a person in an urban environment. These persons may be injured, disoriented, lost, or mentally or medically impaired lending urgency to finding the target. In some instances, the target may not wish to be found and will attempt to evade detection. The difference between a rescue and a body recovery is almost always time. To this end, it is incumbent upon UAS operators and team members to develop a clear understanding of ways to maximize time in the air for the best possible outcome. This article puts forth methods for these operators to calculate the width of the field of view of the employed sensors, sometimes called scan width or sensor width, to better calculate track spacing when conducting searches over land or water.
The UAS equipment tested and examined in this article are the DJI Phantom 3 Pro with a visible light camera and the DJI Inspire 1 with aZenmuse X3 visible light camera and a Forward Looking Infrared (FLIR) camera. It is necessary to put forth a limited amount of rudimentary trigonometry to illustrate the theories presented.
TERMINOLOGY: For the purposes of this article, the following terminologies are set forth.
LENS FIELD OF VIEW- The field of view is the part of the world that is visible through the camera at a particular position and orientation in space. Objects outside the field of view are not recorded in the photographs or video taken through this lens. It is most often expressed as the angular size of the view cone. It is often found printed on the barrel of the lens printed FOV and then a number with a degree symbol.
LENS FOCAL LENGTH- The focal length of the lens is the distance between the lens and the image sensor when the subject is in focus. It is usually stated in millimeters and can often be found printed on the lens itself. It is helpful to note that the smaller the focal length the wider the view and the higher the focal length the more of a telescopic effect is noticed.
SCAN WIDTH-The width of the area covered by a pass of the sensor over land or water.
SEARCH AREA- The area assigned to the UAS operator and team to be scanned with the objective of locating the target. This area can often be determined by the Incident Commander based on the target to be located, the amount of time passed since target was last seen, or the anticipated mobility of the target.
SEARCH AREA COVERING TIME- The amount of time required to completely scan the assigned search area one time. This is often a function of speed of the sensor platform over land or water and the track spacing of sensor scans. As will be demonstrated in this paper factors such as altitude, sensor acuity, weather, time of day or night, sensor operator experience and ability, and equipment quality can be critical in lessening the search area covering time.
TARGET- The object of the search.
TARGET CONFIRMATION TIME- The amount of time required to confirm that the object identified is truly the target of the search. The operator can safely lower altitude to get a better look at the target or he or she may rotate around the target to find a better angle by which to view the target. All the factors highlighted play a critical role in the amount of time that the operator takes to accomplish the mission. Each flight of the UAS is limited by the amount of battery life specific to the UAS and any operator taking on such missions should have sufficient batteries and a method by which to charge batteries so that batteries can be rotated in and out of the UAS efficiently to minimize time on the ground and to maximize the time in the air.
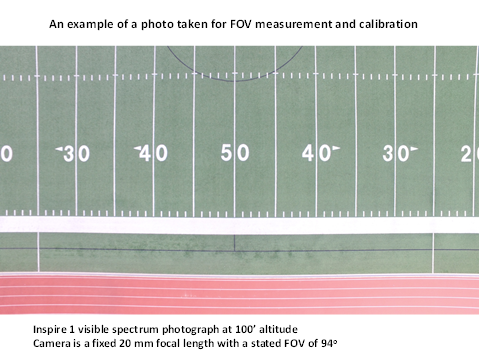
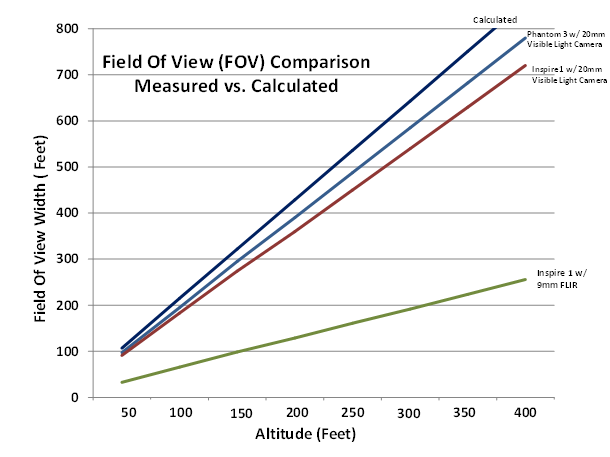
TEST AND CALIBRATION - The DJI Phantom 3 Pro and the Inspire 1 are both equipped with 4K visible spectrum cameras. Both cameras are stated to have a 94o field of view and both lenses are 20 mm in focal length. All tests were conducted using the specific controller intended for the UAS and the same viewing pad and DJI Go software was used for all tests. The viewing and control pad is an Invidia Shield tablet. It was decided that the actual test flights would be conducted over a well marked football field so that photographs could be taken and later analyzed for actual field of view measurements. Flights were centered over the fifty yard line at various altitudes for both UAS. The altitudes chosen for the tests were 100’ and 200’. One photograph was taken with the Inspire at 300’ but the field of view took the photograph well out of the marked areas of the field. Field of view results for the other altitudes presented were calculated using a simple ratio formula since the focal length of the lens and the FOV does not change and results should be linear. The graph bears out that the results for the various altitudes were indeed linear.
All measurements taken were converted from yards to feet before calculations or comparisons were made. The ratio formula used for extrapolating the FOVs for the other altitudes is:
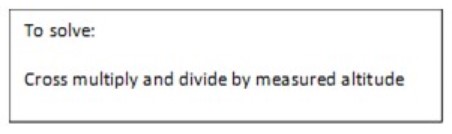
Measured FOV X FOV
____________ = _______________
Measured Altitude Projected Altitude
Photographs were also taken with the Inspire 1 equipped with the FLIR camera and similar calculations were made.
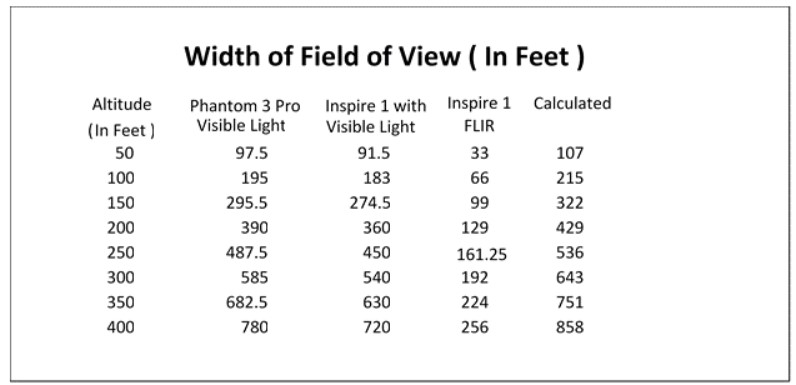
The following chart portrays the width of field of views for the three cameras and also includes the mathematically calculated expected field of views for each altitude.
Once the actual flights were made, the photos taken and the resulting ratio calculations were made for the various altitudes it was decided to validate these measurements with a pure trigometric calculation for each altitude. To further verify the calculations the actual photos and measurements at the 200‘ altitude were checked. The following depiction is the methodology for deriving the pure calculations.
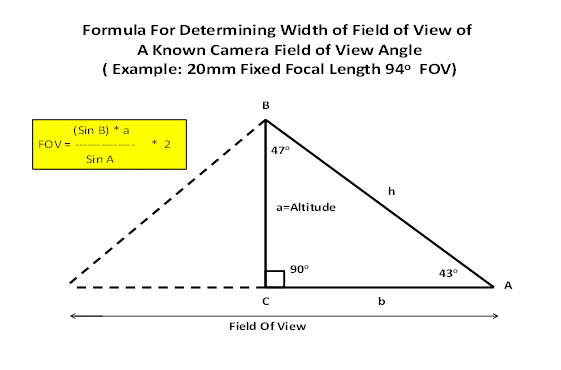
Explanation of calculations for a known lens field of view angle (FOV) and a known altitude:
Note in the triangle depiction above the full field of view is broken in half to allow for conducting the calculations on a right triangle. The FOV of the lens is known to be 94o, so ½ of 94 is 47, accounting for the 47o as angle B. It is known that the side a of the right triangle is perpendicular to the horizontal accounting for the angle C to be 90o. It is known that the interior angles of a right triangle must equal 180o so therefore this calculates that angle A must be 43o. It should be noted also that the full field of field view is cut in half to use a right triangle for calculations so we will multiply the results of our formula by 2 to arrive back at the full field of view. Using these results and the known altitudes that we wish to calculate values (FOV) for, simply substitute the various altitudes into the formula and compute for each altitude.
Explanation of calculations for an unknown lens field of view angle (FOV) and a known altitude:
To calculate the FOV angle of a lens if it is not known the following calculations can be made using the same right triangle diagram used in the previous section. Once the photograph is taken from a known altitude, for example 100’, let side a of the right triangle equal 100. After measuring the field of view coverage from the 100’ altitude it is found to be 66’. Divide 66 by 2 to work with the right triangle diagram and let side b equal 33. Then using the formula:
a2 + b 2 = h2
(10,000 + 1,089) = 11,0892
Take the square root of 11,089 which results in 105.3 which in turn is your side h.
Having the three sides of the right triangle then allows us to solve for two of the other angles of the triangle since we already know that angle C in a right triangle is 90o.
With this information we can now use the angle version of the Law of Cosines.
This will be cos (A) = c2 + a2 – b2
2 ca
cos(A) = 332 + 105.32 - 1002
2 (33) (105.3)
cos(A) = .3132
cos-1(A) = .3132
A = 71.7478
Finding angle A to be 71.74o and knowing that angle c = 90 degrees we can subtract from 180 to find that angle B is 18.2522 degrees. Multiply this result by 2 to get the full calculated lens FOV to be 36.5 degrees.
The figure below graphically depicts the measured, extrapolated and calculated results.
ANALYSIS AND SUMMARY
The field tests and the pure trigonometry calculations are within a satisfactory range of each other to validate the tests. The slight variations in the field of view of the visible spectrum cameras may be accounted for by slight variations in the internal image sensors or in the way that the visual imaging is processed within each camera. The FLIR camera varies greatly from the visible spectrum cameras in many ways to include a much shorter focal length lens and the digital size of the image captured and that may account for the radical variation in field of view numbers. In the final analysis there is a high level of confidence in the field test images captured as each of the photos were taken in the same location and at corresponding altitudes. The trigonometry formulas are all standard formulas so the confidence level is high in the data produced. The end result is a useful analysis of the actual performance that can be expected in the field from each of the components and should be reviewed periodically by working UAS pilots and team members to better enhance their skill levels and chances for successful missions.
It is not required for UAS pilots and team members to be overly knowledgeable about optics and trigonometry but it is helpful in the performance of their tasks to have a basic understanding of their systems and the inherent capabilities of the aerial platforms and its components. A cursory knowledge of terminologies with regards to UAS cameras and FLIR optics in context to what these specifications mean in the field during actual application enhances these teams ability to perform efficiently.All working pilots and teams are encouraged to conduct similar tests on their specific equipment to obtain data specific to their equipment. The methodologies may be used by these teams or they may wish to create their own test methods and analysis.
The data produced in this report can be and should be used to better implement more efficient and effective flight search patterns by more carefully spacing the scan tracks to insure that all of the search area is covered and that scan patterns do not overlap too much so as to waste battery life and more importantly time during searches.
Next time maybe we will bore the heck out of each other and launch into a discussion of track spacing for maximum use of geography, battery life, and time. Hey, maybe we can do some optimization calculus!
Author contact information: R. Riley Land rland@columbusga.org